For only £11.99 extra a month!
£50 setup
Call us now to book your setup! 02890424366
Visualize your cash flow history like never before with our cutting-edge visualization chart. This powerful tool transforms
your cash flow into two intuitive graphs, making it easy to identify financial trends across the fiscal year.
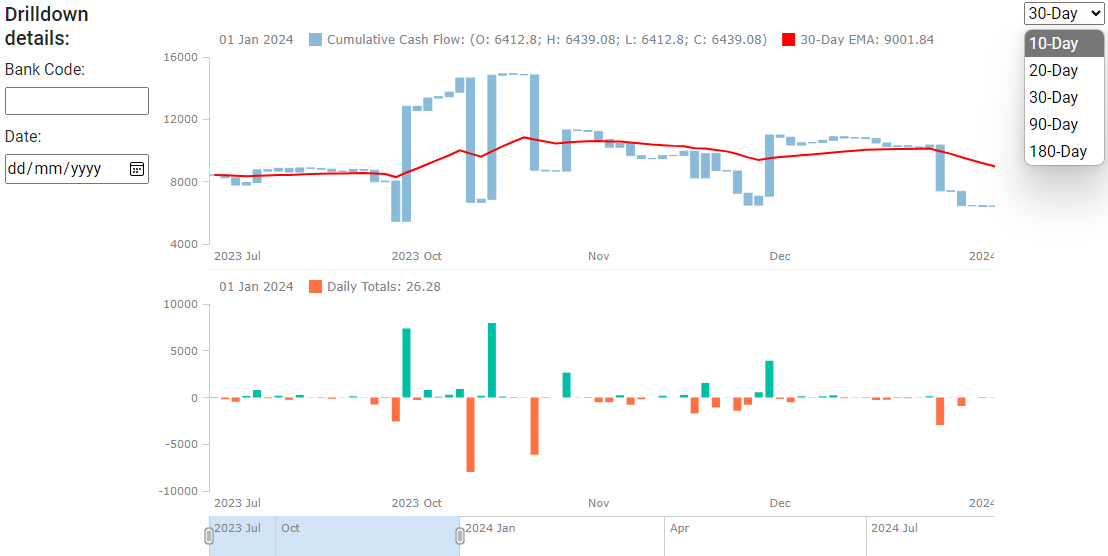
- Graph 1: Tracks cash inflow and expenditure, showcasing your business's financial peaks and valleys.
- Graph 2: Maps daily transaction values alongside these trends for deeper insights.
- Moving average trend line: Discover trends over your financial year with 20, 30, 90 and 180 day moving averages to track your cashflow trends.
With interactive features like point-hovering, you can instantly access key details such as highest and lowest account values and daily changes.
Use our drilldown feature to select any date on the graph and drilldown into detailed breakdowns to analyse your transactions for that specific day.
Unlock the potential of your cash flow today and gain clarity on your business's financial journey!
125
30/01/2024
Transaction Drilldown
Use our drilldown feature to select any date on the graph to drilldown into detailed data for that specific day to analyse transaction breakdowns.
Unlock the potential of your cash flow today and gain clarity on your business's financial journey!
| JnlDate | InvNo | PageNo | CCCode4 | GLCodeNo | CustomerSupplier | Value | Notes |
|---|